I had the opportunity this week to participate in a workshop “Reimagining the ED” that was part of the Healthcare Facilities Symposium taking place in Austin. The workshop was organized and led by Durell Coleman of DC Design.
The goal of the workshop was to identify issues common to emergency departments and then offer creative solutions for those problems. The effort was on behalf of the Federal Guidelines Institute (FGI) in support of incorporating new ideas into the design guidelines that would improve the efficiency and effective ness of hospital emergency departments. Roughly a hundred clinicians and designers participated, assisted by architecture students from Texas A&M University.
I had volunteered to provide some data to describe “Who’s coming to the ED?” that Durell included in his framework for the workshop. In the interest of focus, he included an abbreviated version. For those who want a deeper dive, below is the full deck of content that I provided to him.
Twenty years ago
Working on programming for a large, urban emergency department, it was clear that analysis of data could help resolve the tension between the resources the staff insisted were needed and the resources administration felt it could make available.
Any estimation of workflow that included computational averages immediately got skewered as missing an important element of the workflow: volume arrived in predictable patterns but the patterns were hard to quantify. It was decided that having better insight to the workload justified the effort needed to compile time-of-day data by hand from the paper records then being used. What did that data tell us? [Figure 1]
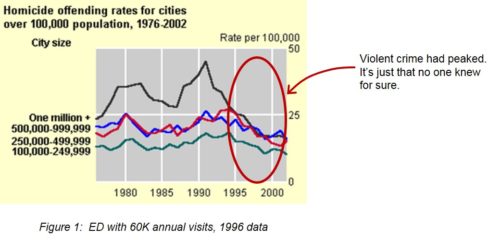
Even though the peak of urban street violence had already passed [see Figure 2], there was still strongly-held concern that the tide would still sweep everything before it. When arrivals per hour were tabulated, the pattern was clear. The so-called “knife and gun club” was, in fact, there as a peak in the late evening volume. The peak was even more extreme for Fridays and Saturdays which were also the busiest days.
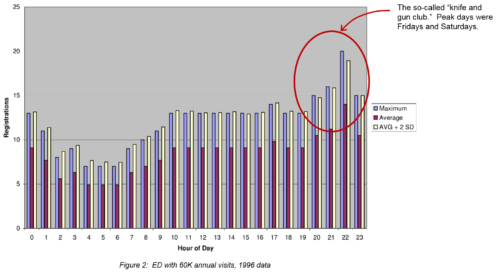
This finding and others set the tone for many features for the emergency department: perimeter security, magnetometers, separate portals and provisions for staff safety. Oh yeah, we still had to diagnose, treat, admit and discharge.
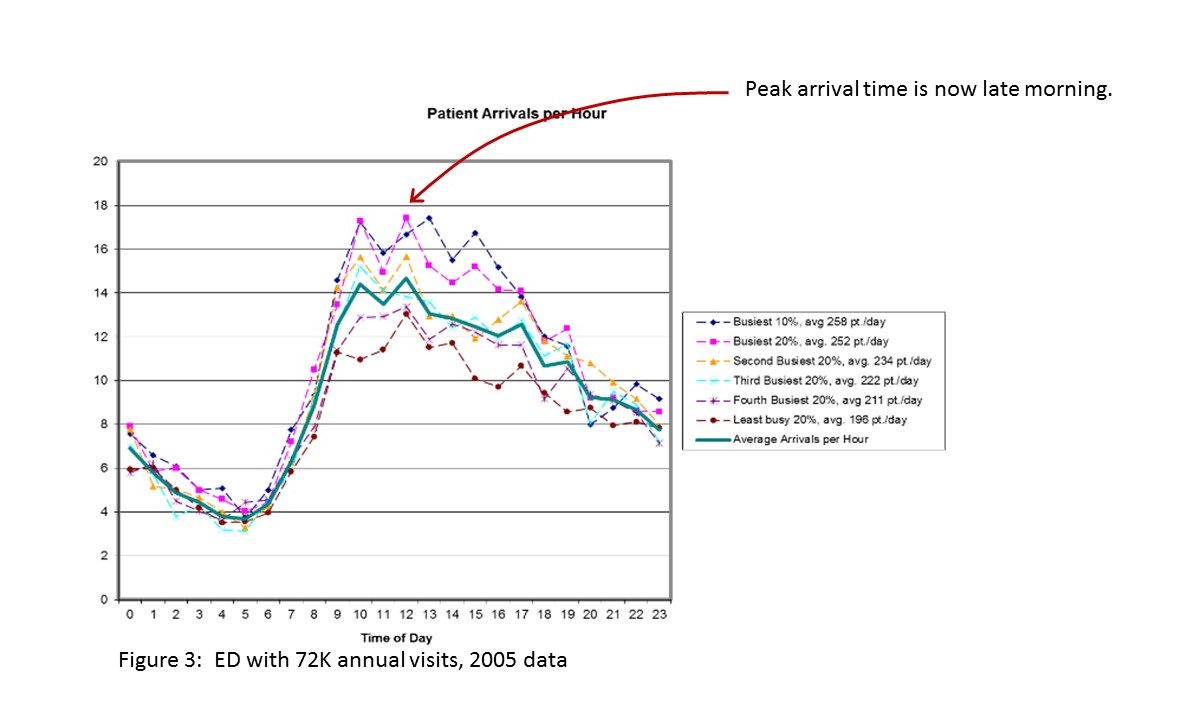
Ten years later
Data on patient arrivals ten years later told a different story. (…and electronic records could be queried so no more hand tabulation!) The continued decrease in urban, violent crime had reshaped the curve of the arrivals-by-hour chart. (I know the idea that violent crime is in steady decline doesn’t fit some current political narratives. Check the data.)
The “knife and gun club” isn’t gone, but it has declined. That volume was now swamped by patient arrivals that could be said to peak mid-morning but really run steadily throughout the day. [see Figure 3]
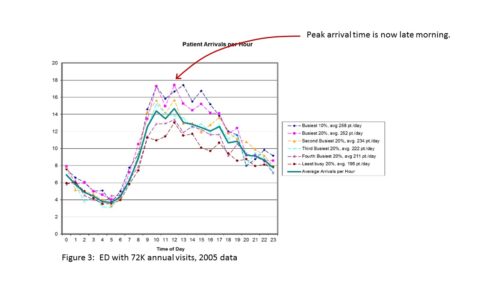
It doesn’t explain everything in the chart but one realization of this era was that the emergency department was becoming the only access point to healthcare that was available, on-demand to the uninsured. Just to put an exclamation point on the change, guess what day of the week is now the highest average volume? You guessed it..it is Monday!
In this decade, subsequent to ACA
In this decade, data availability has definitely gotten better. Not only is time-of-day analysis a snap (sort-of), but we can now stratify those patient data by their eventual Emergency Severity Index (ESI). If your patient volume profile looks like this one, only one patient out of eight fall into the two most critical categories (resuscitation and emergent) and another third are the urgent cases that will need an array of resources. [see Figure 4]
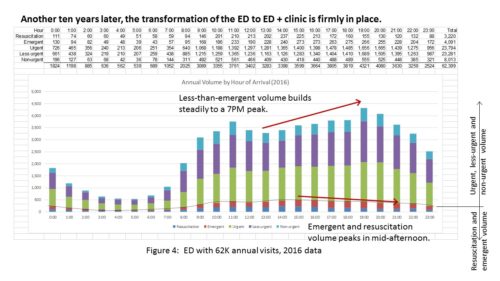
That leaves fully one-half of patients who are in ESI categories 4 and 5. Yes, the poster child for Level 5 is the healthy person with poison ivy.
Everyone thought that with the ACA, patients with routine needs could be shifted away from the emergency department into more conventional primary care channels. For whatever reason, that hasn’t happened and more emergency department directors are coming to the realization that they must address the issue first through process improvement – handling the increased volume via better throughput and secondly via planning/re-planning of the physical environment.
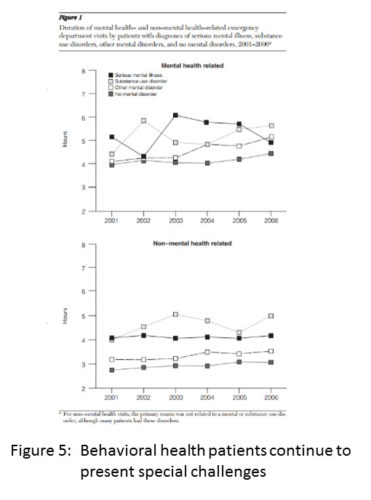
A last point to make about “who is coming” relates to behavioral health. I once had a practitioner point out to me “that the incidence and prevalence of psychiatric problems favors no race or class.” What has changed of late is that more Americans have access to behavioral healthcare, thanks to the ACA. Unfortunately, many are brought to the ED by the epidemic of substance abuse fueled by opioids. Thankfully, the emergency department is there to care for them. [Figure 5] (One participant on Monday challenged the group by asking, why is it that the emergency department is the only one without established nurse-to-patient staffing ratios?)
We do see a trend in our practice of emergency departments implementing improvements to handle behavioral health patients. The key drivers of these projects are:
- Patient safety
- Staff safety
- Diagnostic and treatment resources
Studies make it clear that a behavioral health patient average length of stay (ALOS) is typically 40%+ longer than other ED patients. This amplifies the treatment room shortage in a way similar to boarding patients waiting for admission. Just when your ED is at its busiest, your ED is effectively shrinking in size as more treatment rooms are occupied by patients with long lengths of stay.
Feeling the strain in your ED? We can help you understand “who’s coming” and how to serve them better.
About the Author: Tom‘s commitment to healthcare planning and design is the result of 35 years of practice working with leading healthcare systems and academic medical centers. He advocates for innovation in technology and evidence-based design in order to continually create value for our clients, while staying at the forefront of planning and design.